Hello, and welcome to another edition of Too Much Information. With the increased frequency of Open Series events, and the additional data that comes
with them, we’ve been asked to help out with the Legacy analysis. We’re happy to have the opportunity, and we hope you find the results useful.
The Boston and Charlotte Legacy Opens have once more showcased a highly diverse and balanced format. Many of the popular decks performed reasonably
well, but none of them were dominant.
The following tables display the popularity and performance of each deck that made up more than 1% of the field at either tournament. The first table
shows the results of Boston, and the second those of Charlotte. Download the whole spreadsheet here.
Breaking with past Too Much Information articles, these win percentages were calculated without subtracting matches between decks of the same type.
This causes a slight trend towards a 50% win rate for every deck, with that trend being more pronounced the more popular the deck is. Obviously, a deck
with a positive win record against the rest of the field will get worse if mirror matches become more common, so our analysis should reflect that.
In keeping with previous articles, a draw is counted as a third of a win because it awards one point rather than three.
The last column in the tables shows a number we are calling “expected value,” which is calculated by multiplying a deck’s aggregate matchup win
percentages (over the course of 2011, in this case) by each of the corresponding decks’ field percentages in the given tournament, and then adding up
the results. If data is not available for a specific matchup, that matchup is assumed to be even. The expected value (EV) represents the probability of
the deck in question to win the average match against a random deck in a given field (more accurately, it describes the percentage of possible points
that the deck is expected to claim), and higher values should roughly correlate to those decks that performed well at an event.
For example, to calculate Merfolk’s expected value for Boston, we multiply its matchup against the mirror over the course of the year (49.58%) with
Merfolk’s field presence in Boston (11.11%), which equals 5.51%, then add Merfolk’s matchup against Bant (50.90%) times Bant’s field presence (9.52%),
which equals 4.85%, and then continue through the rest of the field, for a final value of 51.74%.
An EV of 51.74% is not exceptional, but it is positive, and it isn’t far from Merfolk’s actual performance in the event. If the numbers were further
apart, we might seek explanation, such as matchups somehow changing for that event, or pairings that were not representative of the field.
Boston Legacy Open Breakdown
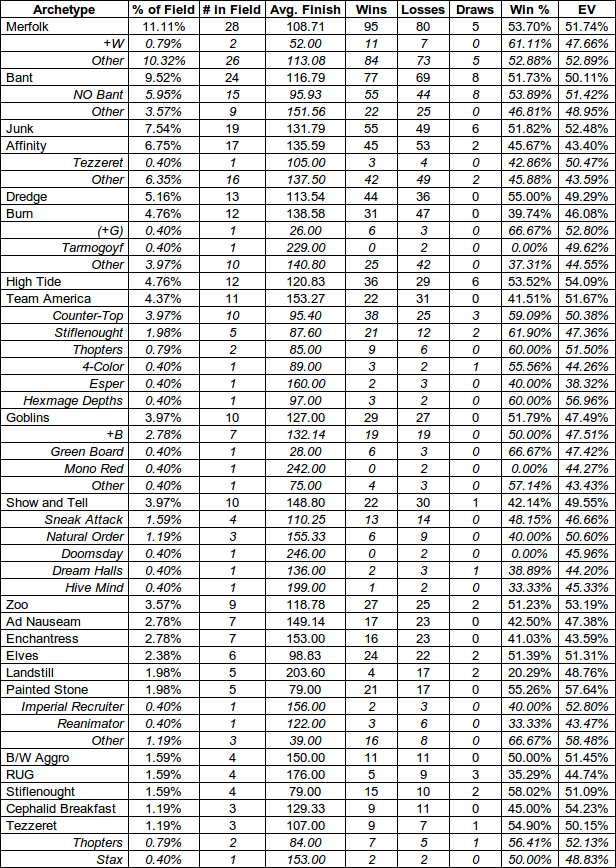
Last month, we saw that Merfolk was consistently the most popular deck, with a host of other decks fighting for second place. Merfolk was once again
the largest segment of the field in Boston, but Bant jumped in popularity to become the second largest. Both had solid performances to justify their
presence (and, of course, Merfolk won the whole thing). Bant’s spike in popularity likely had something to do with the Atlanta Top 8, which featured
two of them. Most Bant builds in Boston ran Natural Order, and the Natural Order builds performed better than the others (which won less than half of
their matches).
Moving down the list, we see Junk, Affinity, and Dredge, which have consistently been little more than 5% of the field in recent events. Junk and
Dredge posted favorable records, while Affinity did not. Burn, which was rare at the beginning of the year but made up 6.48% of the field in L.A. and
4.29% in Atlanta, showed up in similar numbers in Boston but performed terribly. High Tide showed up in numbers for the first time and performed well.
As we might expect, the EV tends to closely follow the win percentage, at least for popular decks. Notable deviations are Dredge, Team America, and
Counter-Top, suggesting that their performances may have been strongly influenced by variance. Dredge and Counter-Top, which performed better than any
of the other popular decks, both outperformed their EVs, which are close to even. Team America performed much worse than its EV would have predicted.
These discrepancies should make us hesitant to use the results of this tournament to justify either playing Dredge or Counter-Top, or avoiding Team
America.
Charlotte Legacy Open Breakdown
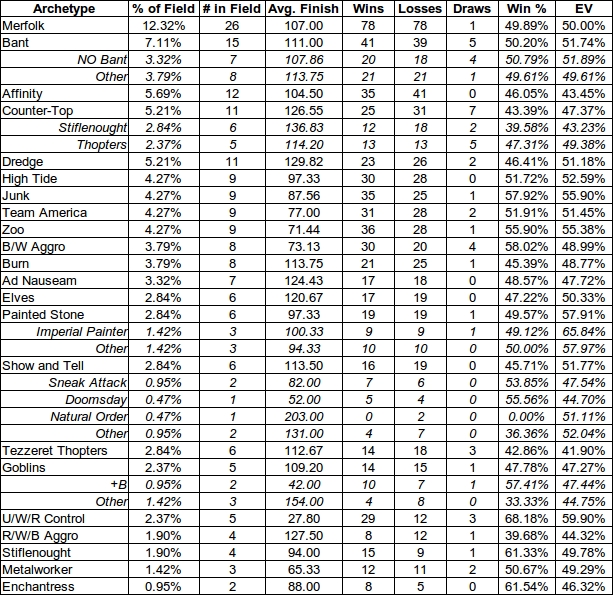
Once again, Merfolk was the most popular deck, followed by Bant. The highest performers were Junk, Zoo, and B/W Aggro (which isn’t exactly an
established deck, but Tim Frank’s list from the Top 8 shows us
what the most successful one looked like). Unlike the most successful decks in Boston, both Junk and Zoo can back up the observed win percentages with
high EVs, suggesting that the metagame was actually good for those decks. (We can’t say the same for B/W Aggro, but the less popular a deck is, the
less matchup data we have for it, and so the less useful the EV is.)
Indeed, both Counter-Top and Dredge, which saw unusually strong results in Boston, were unsuccessful in Charlotte. Affinity continued to perform
poorly. The other popular decks all posted close-to-even records to match close-to-even EVs.
In the last installment of Too Much Information, we saw that Goblins had a shockingly low 39.53% win percentage across Memphis, Dallas, Los Angeles,
and Atlanta. Since then, its popularity has dropped drastically (on average, it was the second-most popular deck in those tournaments), but it
performed significantly better in Boston and Charlotte. The little green men had a positive record in Boston and won 50.39% of their matches across
both tournaments.
To dig a little deeper, we’re going to look at the matchups among the most popular decks—those that were at least 5% of the field in either
tournament. We’ll also look at High Tide, which is just now prevalent enough to meaningfully analyze, and Zoo, which performed particularly well in
both events. For each of those decks, we’ll look at its field presence and win percentage in Boston and Charlotte, its records against the other
popular decks in Boston and Charlotte, and its “overall” matchup statistics, which include all tournaments this year.
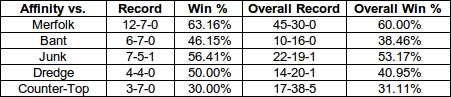
Merfolk—11.66% of Field—Won 51.93% of Matches
Example: Alex Bertoncini, 1st place—Boston Legacy Open
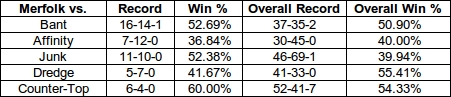
Merfolk remains the most popular deck in Legacy and continues to perform well. Its matchups against the other popular decks are all quite close.
Interestingly, this includes its matchup against Counter-Top, where Merfolk is generally thought to be a strong favorite.
Bant—8.42% of Field—Won 51.19% of Matches
Example: Paul Ewenstein, 10th place—Boston Legacy Open
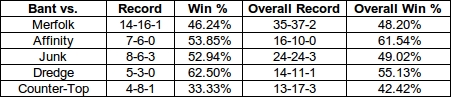
Bant posts the most surprising increase in field presence for these two tournaments: it’s gone from rarely breaking 5% to the second-most popular deck.
Its record is about as good as Merfolk’s. About half of the Bant decks in Boston and Charlotte played Natural Order, and those builds performed better
than the others, winning 53.02% of matches as opposed to 48.15% (though this has not been consistent throughout the year—Natural Order builds
have sometimes performed worse). It looks like the deck is strong against Affinity, slightly weak against Counter-Top, and has close matchups against
the other popular decks.
Affinity—6.26% of Field—Won 45.83% of Matches
Example: N/A
Affinity remains somewhat popular but continues to perform poorly. It’s the only deck that made up at least 5% of the field in these two events but won
less than 50% of its matches. None made Top 16 at either tournament. It has reasonable Junk and Merfolk matchups but has consistently lost to
Counter-Top and seems to be bad against the rising Bant decks as well. Whether Affinity’s poor performance since Dallas is a result of metagame shifts
or increased levels of hate is unclear.
Junk—6.05% of Field—Won 54.00% of Matches
Example: Kyle Miller, 2nd place—Charlotte Legacy Open
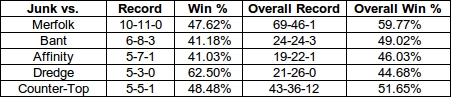
Junk was the top performer out of the most popular decks in the last two tournaments, even though its record against those other decks wasn’t very
impressive. Including the data from previous tournaments, however, tells us that the Merfolk matchup is actually in Junk’s favor, and the matchups
against most of the other top decks are very close.
Dredge—5.18% of Field—Won 51.65% of Matches
Example: Chris Piland, 7th place—Charlotte Legacy Open
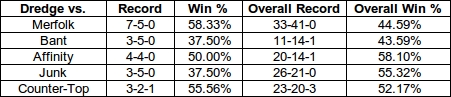
Dredge posted a winning record in Boston and a losing record in Charlotte, which resulted in an overall win percentage close to 50%. As with Affinity,
it’s difficult to tell how much graveyard hate is being played or how much this affects Dredge’s performance. When considering Dredge’s matchup
percentages, the overall numbers are useful here, because the last two events don’t give us much data.
Counter-Top—4.54% of Field—Won 51.42% of Matches
Example: Samuel Wang, 7th place—Boston Legacy Open
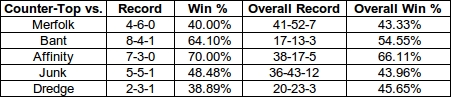
Counter-Top’s popularity has dramatically decreased over the past few months, but it did perform about as well as most of the more popular decks over
these two tournaments. The most interesting result here is probably the Affinity matchups, which apparently tend to favor Counter-Top. As we mentioned
earlier, it’s also worth noting that the Merfolk matchup, while unfavorable, is not as lopsided as we thought. Both results seem consistent among
sub-archetypes of Counter-Top (based on the limited data we have for the most popular sub-archetypes).
High Tide—4.54% of Field—Won 52.71% of Matches
Example: Joshua Justice, 13th place—Charlotte Legacy Open
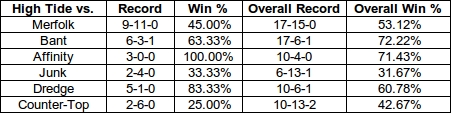
High Tide was one of the biggest unknowns going in to these events. How many people would pick it up after Atlanta? How well would it perform against
prepared opponents? The answer is that its overall win percentage is down but still respectable. The deck did become a little more popular, so we have
enough data to start looking at some of its matchups. The Merfolk matchup is very close, with Merfolk winning more in the last two events but High Tide
winning more overall. The Bant and Affinity matchups are very good, and the Junk matchup is surprisingly bad. The deck has lost most of its matches to
Counter-Top but not by a huge margin. The favorable record against Dredge, which is extremely hard for High Tide to beat when it works well, is
surprising. Note that the sample sizes for most of these matches, even looking at the overall numbers, are somewhat small.
Zoo—3.89% of Field—Won 53.78% of Matches
Example: N/A
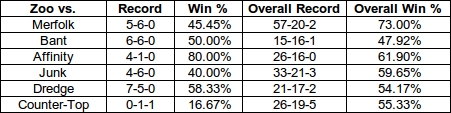
Despite not making Top 16, Zoo performed very well in these tournaments, with solid records against the top decks. It’s become less popular recently,
so we don’t have much data from Boston and Charlotte, but we can look at the overall matchup numbers. Of course, its Merfolk matchup is traditionally
fantastic, despite a poor record this time. Zoo also tends to beat Affinity and Junk, with very close matchups against the rest of the top decks. With
positive matchups against most interactive decks and a great matchup against the consistently most popular deck, Zoo is often a good choice.
As a bonus section, we’re going to take a look at combo decks, as a category. Since the SCG Open in Los Angeles, there’s been a lot of talk about combo
decks becoming more popular and performing better than they had before, so it is worthwhile to examine whether the data supports those claims.
For this analysis, we’ll be grouping together all combo decks that have made up at least 1% of the field in at least one tournament this year. We’ll
define combo decks roughly as non-interactive decks with powerful proactive game plans—so-called “unfair” decks. These decks are Dredge, Ad
Nauseam, Show and Tell, Elves, High Tide, Painted Stone, Enchantress, Charbelcher, Reanimator, Cephalid Breakfast, TES, and Aluren.
Combo—26.13% of Field—Won 48.57% of Matches
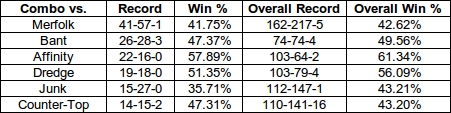
When looking at such a large grouping of decks, it’s a little dangerous to draw specific conclusions about individual matchups. However, it is not
surprising to see highly disruptive decks such as Merfolk, Counter-Top, and Junk posting favorable records against the category. It is interesting to
note that Bant does not seem to enjoy as strong of a matchup against combo decks, which makes sense, as most Bant decks tend to run fewer disruptive
elements than the other two blue decks. As a group, combo did not perform exceptionally well in these events. It won slightly less than half of its
matches and posted unfavorable records against four out of the six most popular decks.
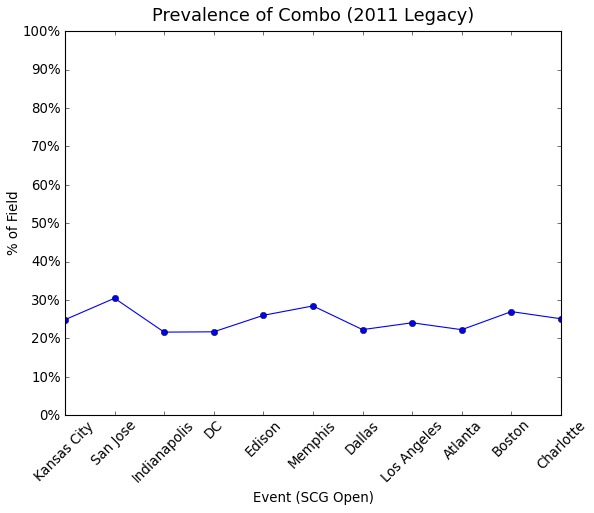
The graph above displays the combo category’s popularity over the course of the year. Combo’s percentage of the field varies from event to event, but
there are no obvious trends associated with these fluctuations. Roughly speaking, combo has made up about a quarter of the field at each event this
year.
As it stands now, combo decks make up a sizeable but stable portion of the metagame and combine to post a mediocre record. Thus, the Open Series has
not experienced the “rise of combo” that some have alluded to. Also, with the introduction of New Phyrexia looming, the format may soon
become a more hostile environment to non-interactive decks.
Specifically, Mental Misstep will almost certainly become a Legacy staple. With the two most popular decks, Merfolk and Bant, already being disruptive
blue decks, we can expect to see quite a few Missteps in Orlando. It will be interesting to see where else the card finds a home.
For now, it appears that all of the decks we looked at, with the exception of Affinity, are acceptable choices, but this may change in the weeks
leading up to Grand Prix Providence.
If anyone has any questions about the data or the methodology, we’ll be happy to discuss it in the forums.
Alix Hatfield (Obfuscate Freely)
Jesse Hatfield (Mad Zur)