The last article I wrote was posted on March 22nd, 2007. There has clearly been a gap between then and now. I had planned on writing a report of GP: not-quite-Boston but that fell through due partly to my poor performance but mostly due to lack of time. April for me was a blur of business trips, preparation for said business trips, parent birthdays, my wedding and honeymoon. I could have whipped up something quickly, but knew that it would not be well thought out or planned and would likely induce a server crash for StarCityGames.com from the amount of forum posts bashing it. Dodged that bullet. But I’m back now, happily married and amazingly still able to game (huzzah!). I’ve received some feedback that folks would be interested in seeing how I track the Jonny Drafts hosted by Jonny Magic himself.
For those not familiar with what I’m talking about, it really is simple: Jon has people to his apartment frequently for drafts, and we keep track of how people are doing. I created a database to house all the information, below you’ll find how you can create yours. I consider myself as being better than average with Access, almost advanced. There are a number of tools the program has that I don’t know how to utilize and it is entirely possible that there are different or better ways to achieve the results I am. If you know of these, by all means please let me know. Everything is also, of course, set up according to my preference and that of my statistical audience (the 43 gamers currently in the database). If your group wants different stats or a different layout, please pursue those. This should give you a foundation for how to do that.
Finally, please note that the most difficult part of tracking these statistics is not-at-all the set-up. The set-up takes some time and can be harrowing, but the maintenance and data entry of new results far surpasses in terms of difficulty and time investment. Even harder though, is getting all of your lazy gamer friends to send you the results from their draft sessions.
DraftStats — How to Track Your Casual Drafts
DraftStats was created as a means to supporting or refuting the all-too-commonly-heard lines of, “I never win when you’re on my team,” or, “I win like 80% of my matches but my team always loses.” Our local drafting group has about 20 gamers who very regularly play, with supplementary affiliates who play less frequently but bring the total number of gamers over 40. In July of 2006 Tim McKenna and I independently thought that we should begin tracking results of drafts. A group of us decided what information we wanted to track and I built a quick database using Microsoft Access.
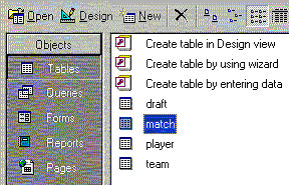
The data is all housed in Access, and presented in MS Excel on various different tabs within the same spreadsheet. The database (DB from now on) has undergone a number of revisions since then and is currently on version 3.1. The DB was set up as a relational DB, meaning that there are separate tables housing data which all relate to each other via shared columns. There are currently 4 basic tables we are using:
Draft
Match
Player
Team
From these tables, the current stats we track are:
Match Win %
Total Matches
Draft Win %
Total Drafts
Rating
Earnings
Draft v Match Win %
The first 4 metrics are straightforward. The totals are a count of how many matches or drafts the player has participated in, and the win % is the number of wins by that player divided by the total for that player.
For Rating we are utilizing the formula developed by the DCI and used in sanctioned Magic play today. I’ll show you the details further down. For reference, we are currently treating all events as 20K, but do have the flexibility to fluctuate if we choose to.
The Earnings metric is based on an entirely fictitious monetary system resembling United States Dollars called pride-bucks. For each draft, a player can wager an amount of pride-bucks usually between 20 and 100. Some people will cover what is called the “over,” meaning if one team’s wagers are less than the other’s, the over will cover the difference.
Draft v Match Win % is simply a subtraction of the two mentioned metrics and is used to determine if a gamer’s team is performing better or worse than the gamer himself.
Each metric can be trended weekly or monthly and broken up based on any number of criteria such as format, with player X on their team or on the opposing team. Before we get further into the metrics though, first let’s examine the table structure as that is from where everything will be derived.
I’m going to walk through each step under the assumption that the reader is not familiar with MS Access. If you are experienced with this program, parts of this may seem overly simplistic to you. Please skip those parts.
To create a table, click on the Objects tab on the left hand side and then double click on “Create Table in Design View.” It will bring you to a blank table screen with 3 columns, Field Name, Data Type and Description. The first 2 fields are required, the description is not but can be used if you want to.
Enter in the Field Names for your table. Note, when creating names of fields, it is best to avoid use of special characters (such as spaces, asterisk, etc). If you want more than 1 word, I recommend using an underscore (e.g. Player_Name instead of Player Name). For each field you should choose a Data Type. When done, save the table. Repeat this process for each of the four tables being created. Below are the fields you’ll need.
| Table | Field Name | Data Type |
| Draft | Draft_ID | AutoNumber |
| Draft | Format | Text |
| Draft | Date | Date/Time |
| Draft | Win_Team_ID | Number |
| Draft | K_Value | Number |
| Match | Draft_ID | Number |
| Match | Match_ID | AutoNumber |
| Match | Win_Player_ID | Number |
| Match | Lose_Player_ID | Number |
| Player | Player_ID | AutoNumber |
| Player | Gamer | Text |
| Player | Phone | Text |
| Team | Team_ID | Number |
| Team | Draft_ID | Number |
| Team | Player_ID | Number |
| Team | Stakes | Currency |
When you’re done, you should have a screen that looks like this:
If you are planning on using this DB to track non-team matches, the structure would change. For instance, if you want to create a DB to track statistics on playtesting sessions, your Draft table might be a Session table, and you could eliminate the Team table all together. You would have to add a table for deck choice though. If anyone is trying to set up a DB for something other than what I’m showing here, I’d be happy to assist, however I don’t want to get into all of the possibilities here are they are, obviously, endless. I should also point out that the “Phone” field on the Player table is used only to house phone number information, not for statistics. If you don’t want this, you can eliminate it. You could also add email address or other contact information if you please.
The AutoNumber data type will make it so the system will create a new sequential number for you every time you add information. This saves some time when entering in data, and also lessens the chance for human error. Text, number, Date/Time and Currency are all self-explanatory.
The fields in bold are primary keys. This means that they cannot be duplicates, and that they are indexed by the DB; making them easier to join the tables on them. From looking at the tables, you can probably see how each one relates to the other. Draft and join to Match based on the Draft_ID. Player can join Match on either the Win_Player_ID or Lose_Player_ID. Team can join Draft on Draft_ID and Team_ID, or Player on Player_ID. The purpose of breaking these up into tables instead of one long sheet containing all data points for every match is that it saves a significant amount of memory space, as well as time when keying in the data. Before we get to writing queries, I recommend getting some data loaded into your tables. Below is some sample data of how it should end up looking, taken directly from our DB.
Draft
| draft_ID | Format | Date | Win_Team_ID | K_Value |
| 1 | RGD | 21-Jul-06 | 2 | 20 |
| 2 | RGD | 21-Jul-06 | 1 | 20 |
| 3 | RGD | 21-Jul-06 | 1 | 20 |
Match
| Draft_ID | Match_ID | winner_id | loser_id |
| 1 | 1 | 7 | 19 |
| 1 | 2 | 7 | 13 |
| 1 | 3 | 7 | 22 |
| 1 | 4 | 20 | 22 |
| 1 | 5 | 20 | 19 |
| 2 | 6 | 7 | 4 |
| 2 | 7 | 7 | 2 |
| 2 | 8 | 7 | 12 |
| 2 | 9 | 4 | 17 |
| 2 | 10 | 2 | 17 |
| 2 | 11 | 12 | 17 |
| 2 | 12 | 21 | 4 |
| 2 | 13 | 21 | 2 |
| 2 | 14 | 12 | 21 |
| 3 | 15 | 19 | 22 |
| 3 | 16 | 19 | 10 |
| 3 | 17 | 2 | 19 |
| 3 | 18 | 4 | 22 |
| 3 | 19 | 10 | 4 |
| 3 | 20 | 4 | 2 |
| 3 | 21 | 7 | 22 |
| 3 | 22 | 10 | 7 |
| 3 | 23 | 2 | 7 |
Player
| Player_ID | Gamer | Phone |
| 1 | Balandin, Alex | (999) 999-9999 |
| 2 | Berger, Eric | (999) 999-9999 |
| 3 | David-Marshall, Brian | (999) 999-9999 |
| 4 | Finkel, Jon | (999) 999-9999 |
| 5 | Flores, Michael J | (999) 999-9999 |
| 6 | Frayman, Igor | (999) 999-9999 |
| 7 | Jordan, Paul | (999) 999-9999 |
Team
| Team_ID | Draft_ID | Player_ID | Stakes |
| 1 | 1 | 22 | $20.00 |
| 1 | 1 | 13 | $20.00 |
| 1 | 1 | 19 | $20.00 |
| 2 | 1 | 7 | $20.00 |
| 2 | 1 | 20 | $20.00 |
| 2 | 1 | 12 | $20.00 |
| 1 | 2 | 7 | $20.00 |
| 1 | 2 | 17 | $100.00 |
| 1 | 2 | 21 | $100.00 |
| 2 | 2 | 4 | $180.00 |
| 2 | 2 | 2 | $20.00 |
| 2 | 2 | 12 | $20.00 |
| 1 | 3 | 19 | $20.00 |
| 1 | 3 | 4 | $20.00 |
| 1 | 3 | 7 | $20.00 |
| 2 | 3 | 22 | $20.00 |
| 2 | 3 | 10 | $20.00 |
| 2 | 3 | 2 | $20.00 |
These are obviously not the complete tables, those would take up too much space (our match table alone has over 2,000 matches currently. The more data you have in your tables, the easier it will be to notice an error in your queries. Queries will be used to extract some meaning from these tables. Looking at them right now, it is difficult to figure out what they are saying. The reason for the use of the ID’s is both that it allows for much easier linking, but it also makes data entry smoother by tenfold (imagine having to key in “Jordan, Paul” each time, instead of just “7”). The biggest difficulty I had when setting this up was to track one gamer from match to match in one query. Since the Player_ID could be in either the Win_Player_ID or Lose_Player_ID column, there was no intuitive way for the system to track a person. So the first thing I had to do was write a query to expand the data. Most queries for this DB can be created in the Design View of MS Access, which allows you to drag and drop tables and fields. It is user friendly and reasonably intuitive. This first query does something that can’t be done in design view, so I had to write the query in SQL (Structured Query Language). I’ll save you the headache and show you the query here.
To create your first query, click on Queries on the left hand side panel in Access and double click on Create Query in Design View. It will pop up with a window for tables to select from. Close that window, we’ll need it in other queries but not in the first one. In the top left corner, click on the SQL button, it should bring you to a window where free-form text can be entered. In that field, copy/paste the below text:
select
draft_id,
match_id,
winner_id as player_id,
“win” as result,
loser_id as opponent_id
from match
UNION ALL select
draft_id,
match_id,
loser_id,
“lose”,
winner_id
from match
order by match_id;
What this will do is basically duplicate the Match table, giving each match_ID 2 line items, one for each player. This makes it easier to work with. Save this query as match_qry. You can click on the Exclamation Point button or go to Query -> Run to make sure it worked. You should get something that looks like this:
| draft_id | match_id | player_id | result | opponent_id |
| 1 | 1 | 7 | win | 19 |
| 1 | 1 | 19 | lose | 7 |
| 1 | 2 | 13 | lose | 7 |
| 1 | 2 | 7 | win | 13 |
| 1 | 3 | 22 | lose | 7 |
| 1 | 3 | 7 | win | 22 |
| 1 | 4 | 20 | win | 22 |
| 1 | 4 | 22 | lose | 20 |
| 1 | 5 | 20 | win | 19 |
| 1 | 5 | 19 | lose | 20 |
Every query from here on that would reference the match table will now reference this query instead.
From here on out virtually every other query can be done in Design View. The first we’ll look at is generating a quick view of a draft history. Double click on the Create Query in Design View button again, but this time don’t close the table pop-up. Add in the Draft, Player and Team tables, then close the window. Your window should now look like this:
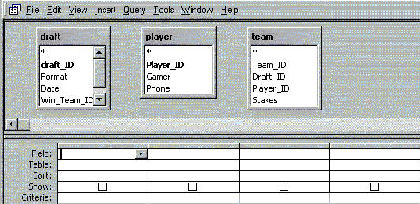
Since some fields are present in multiple tables, I’m going to refer to them as TABLE.FIELD for clarity (e.g. draft.draft_id). Drag Draft.Draft_ID onto Team.Draft_ID. This should connect them with a line. Then do the same for Player.Player_ID and Team.Player_ID. You can rearrange and expand the table windows to make this easier to view. In the end you’ll have something like this:
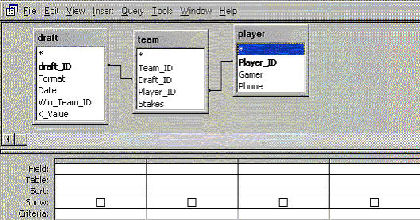
From this picture you can see how items in the Player table will relate to those in the Draft table, even though those 2 tables do not share any columns. Now that the tables are joined, we can begin selecting which fields we want to see in our query. Double clicking any field will populate it in the bottom part of the window, and will include it in the query. Each table has a * as the first item, including this will include all columns from that table. I’m going to include Draft.Draft_ID, Draft.Format, Draft.Date, Draft.K_Value, and Player.Gamer for now.
Instead of having the Winning team ID, I’d rather just have the result for that individual. To get this we can incorporate a formula. On the bottom of the screen, after including the non-formula fields, click on the first empty cell in the Field row and click on the Build button and enter in this formula:
Result:IIF([draft]![Win_Team_ID]=0,”draw”, IIf([draft]![Win_Team_ID]=[team]![Team_ID],”win”,”lose”))
Hit OK to bring you back to the Design View. Go to the next available cell and create another formula, this one for earnings. Use this formula:
Earnings:IIf([Result]=”win”,[team]![Stakes], IIf([Result]=”lose”,[team]![Stakes]*(-1),0))
Finally, in the Sort field, underneath Draft.Draft_ID, click on Ascending. Your screen should now look like this:
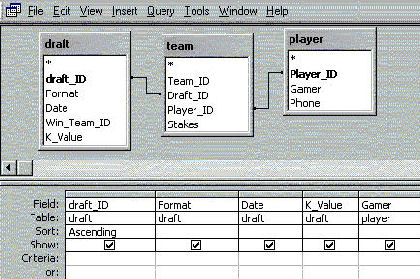
Save the query as draft_history. Try running it, you should get something like this:
| draft_ID | Format | Date | K_Value | Gamer | Result | Earnings |
| 1 | RGD | 22-Jul-06 | 20 | Levin, Julian | lose | ($20.00) |
| 1 | RGD | 22-Jul-06 | 20 | McKenna, Tim | lose | ($20.00) |
| 1 | RGD | 22-Jul-06 | 20 | Tsai, Tony | win | $20.00 |
| 1 | RGD | 22-Jul-06 | 20 | Sadin, Steve | lose | ($20.00) |
| 1 | RGD | 22-Jul-06 | 20 | Jordan, Paul | win | $20.00 |
| 1 | RGD | 22-Jul-06 | 20 | Manning, Chris | win | $20.00 |
| 2 | RGD | 21-Jul-06 | 20 | Wang, Matt | win | $100.00 |
| 2 | RGD | 21-Jul-06 | 20 | Finkel, Jon | lose | ($180.00) |
| 2 | RGD | 21-Jul-06 | 20 | Phillipps, Eric | win | $100.00 |
| 2 | RGD | 21-Jul-06 | 20 | Berger, Eric | lose | ($20.00) |
| 2 | RGD | 21-Jul-06 | 20 | Jordan, Paul | win | $20.00 |
| 2 | RGD | 21-Jul-06 | 20 | Manning, Chris | lose | ($20.00) |
| 3 | RGD | 21-Jul-06 | 20 | Berger, Eric | lose | ($20.00) |
| 3 | RGD | 21-Jul-06 | 20 | Levin, Julian | lose | ($20.00) |
| 3 | RGD | 21-Jul-06 | 20 | Sadin, Steve | win | $20.00 |
| 3 | RGD | 21-Jul-06 | 20 | Kreyer, Ilya | lose | ($20.00) |
| 3 | RGD | 21-Jul-06 | 20 | Finkel, Jon | win | $20.00 |
| 3 | RGD | 21-Jul-06 | 20 | Jordan, Paul | win | $20.00 |
I usually like to also include a column for the Month in queries, which makes it much easier to do trending. To do this, simply add another formula in, this time using
Rpt_Month: Format([draft]![Date],”mm/yyyy”)
Now that we have a draft history, we’ll need the same thing for a match history. Create a new query. This time add the Draft table and then add the Player table twice. Then click on the Query tab and add the match_qry query. Make the following joins:
Draft.Draft_ID with Match_qry.Draft_ID
Match_qry.player_ID with Player.Player_ID
Match_qry.opponent_ID with Player_1.Player_ID
It will look something like this:
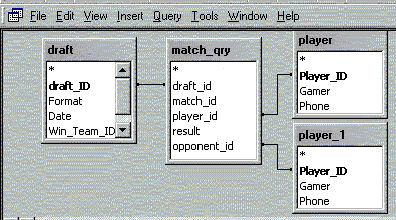
From here you can add in the fields you want. I wanted the draft ID, format, date, match ID, gamer, result and opponent. You’ll need to rename Player_1.Gamer to Opponent, which can be done easily by adding:
Opponent:
in front of the word gamer on the bottom half of the screen. Save this query as match_history and run it, you should get something like this:
| draft_ID | Format | Date | match_id | Gamer | result | Opponent |
| 1 | RGD | 22-Jul-06 | 1 | Jordan, Paul | win | Sadin, Steve |
| 1 | RGD | 22-Jul-06 | 1 | Sadin, Steve | lose | Jordan, Paul |
| 1 | RGD | 22-Jul-06 | 2 | McKenna, Tim | lose | Jordan, Paul |
| 1 | RGD | 22-Jul-06 | 2 | Jordan, Paul | win | McKenna, Tim |
| 1 | RGD | 22-Jul-06 | 3 | Levin, Julian | lose | Jordan, Paul |
| 1 | RGD | 22-Jul-06 | 3 | Jordan, Paul | win | Levin, Julian |
| 1 | RGD | 22-Jul-06 | 4 | Tsai, Tony | win | Levin, Julian |
| 1 | RGD | 22-Jul-06 | 4 | Levin, Julian | lose | Tsai, Tony |
| 1 | RGD | 22-Jul-06 | 5 | Tsai, Tony | win | Sadin, Steve |
| 1 | RGD | 22-Jul-06 | 5 | Sadin, Steve | lose | Tsai, Tony |
Draft_history and Match_history are the basis for everything you need. You could very easily create pivot tables through Excel with this data that will give you a very clear picture of people’s performance.
I’m going to take a detour from Access now to briefly go over the use of Excel. While Access is housing all of the data, Excel does most of the calculations for us. Open up a new spreadsheet. Go to Data -> Pivot Table and Pivot Chart Report. In the pop-up, choose External Data Source. Click on Get Data and then on the next pop-up choose MS Access Database as the source. From there, browse to find your database and select it. It will give you a listing of all of the tables and queries in your DB, choose draft_history for starters. Select all of the fields and keep hitting next until you can hit Finish, then hit Finish. What you’ll end up with is something like this:
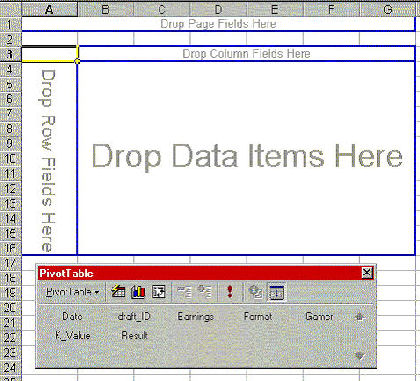
Drag Gamer to the row field and Format to the colum field. Then drag Result next to Gamer (be careful not to drop it in the data items section). Finally, drop draft_ID into the data items. You’ll get something like this:
| Count of draft_ID | Format | ||||
| Gamer | Result | RGD | TTP | TTT | Grand Total |
| Balandin, Alex | draw | 1 | 1 | ||
| lose | 4 | 1 | 1 | 6 | |
| win | 4 | 4 | |||
| Balandin, Alex Total | 9 | 1 | 1 | 11 | |
| Berger, Eric | draw | 1 | 1 | 2 | |
| lose | 13 | 8 | 9 | 30 | |
| win | 7 | 15 | 4 | 26 | |
| Berger, Eric Total | 21 | 24 | 13 | 58 | |
| David-Marshall, Brian | lose | 2 | 6 | 1 | 9 |
| win | 2 | 6 | 1 | 9 | |
| David-Marshall, Brian Total | 4 | 12 | 2 | 18 | |
| Finkel, Jon | draw | 1 | 1 | 2 | |
| lose | 15 | 12 | 14 | 41 | |
| win | 20 | 39 | 20 | 79 | |
| Finkel, Jon Total | 36 | 52 | 34 | 122 | |
| Flores, Michael J | lose | 5 | 5 | ||
| win | 1 | 1 | |||
| Flores, Michael J Total | 6 | 6 | |||
| Frayman, Igor | draw | 1 | 1 | ||
| lose | 4 | 3 | 2 | 9 | |
| win | 5 | 5 | 4 | 14 | |
| Frayman, Igor Total | 9 | 8 | 7 | 24 | |
| Jordan, Paul | draw | 1 | 1 | 2 | |
| lose | 12 | 6 | 12 | 30 | |
| win | 8 | 9 | 7 | 24 | |
| Jordan, Paul Total | 21 | 15 | 20 | 56 | |
| Grand Total | 100 | 118 | 77 | 295 | |
Be sure that it says count of Draft_ID. It may default to a sum. If so, right click on any of the numbers and change the formula from a sum to a count. From this you can create calculations in Excel or more queries in MS Access to give you percentages.
The hardest piece for me to create was a rating. We had the formula used by the DCI:
OLD RATING +(K-VALUE*(1/((10^((OPPONENT RATING-OLD RATING)/400)+1))))
Which is quite intimidating to look at. We know that everyone starts at 1600, we have a K value from the draft table. The tricky part is finding the most recent rating, and then modifying that as necessary, and leaving the new value to be found and modified after the next match. Let me preface this particular section by saying that it is by far the most labor intensive part of doing updates for me, and also requires the most system memory. We’ll have to go back into MS Access for this.
I created a query that returns every match with a lot more information than our match_history query. The basic structure of the query will return to us what the player’s rating was going into the match, the opponent’s rating going into the match, and the player’s rating after the match. We could calculate for the opponent’s new rating as well, but that will be handled when the match is calculated with that person as the player (and the player from the first time as the opponent — remember that the match_qry query has 2 line items for each match_ID).
So what we need to find is the rating after their last match for both the player and the opponent. This means we first need to find the last match. Create a new query with the match_qry query linked to the player table twice (once on player_ID and once on opponent_ID). Now right click on the match_qry table and go to properties. Change the alias to match2. The program will now reference our new query when we ask for match2, and the our match_qry query when was ask for that. Now, create a new field and go to the formula screen and copy/paste this formula:
last_match: IIf((select max(match.match_id) from match where match.player_id = match2.player_id and match.match_id < match2.match_id) > 0,(select max(match.match_id) from match where match.player_id = match2.player_id and match.match_id < match2.match_id),0)
This gives us the player’s last match. We now need the opponent’s last match. Create another field, this time paste this formula:
opp_last_match: IIf((select max(m.match_id) from match m where m.opponent_id = match2.opponent_id and m.match_id < match2.match_id) > 0,(select max(m.match_id) from match m where m.opponent_id = match2.opponent_id and m.match_id < match2.match_id),0)
Now we have the last match for each person. At this point we should have enough information to generate a list of each match, along with each player’s rating at the beginning and end of the match, right? No, but we’re close. This next part is something I’ve struggled with and do not have an optimal solution for yet. I do, however, have a functional solution which I’ll share.
The problem is that I have not been able to find out how to both calculate the rating for the current match while referencing a different line item in the same query, namely the old rating. It ends up creating a circular logic that I’ve not been able to reconcile. So my solution was to simply create a unique identifier for each line item in this query and to let Excel do the work. So I created 4 unique identifiers that can be used to reference various parts of the query output: Player+match, Player+previous, Opponent+match, Opponent+previous. This is so that on any given line item Excel can look up the Player+match from that line item and find it in a previous line item and then find the rating on that line. This formula is much easier. Simply key in:
match_plus_player: [Match_ID] & [player].[Gamer]
last_plus_player: [last_match] & [player].[Gamer]
match_plus_opp: [Match_ID] & [player1].[gamer]
last_plus_opp: [opp_last_match] & [player1][.gamer]
Each of those lines should be a separate column. Add in the rest of the fields we want (Gamer, Opponent, Date, Draft_ID, Format, anything else you want to appear). Save that query. Now we need to move it into Excel. You can either copy/paste it, or go through Excel to get external data. Either way works.
In Excel we’re going to need to create some formulas and to populate them down the entire sheet. Which column is where is very important, below is the order of the columns I’m using. You’re free to change the order, but be aware that the formulas will be affected.
| Column | Field |
| A | match_plus_player |
| B | last_plus_player |
| C | match_plus_opp |
| D | last_plus_opp |
| E | Match_ID |
| F | player_id |
| G | Gamer |
| H | K_Value |
| I | last_match |
| J | opponent_id |
| K | opponent |
| L | Opp_last_match |
| M | Result |
| N | old_rating |
| O | Opp_rating |
| P | odds |
| Q | New_rating |
The last 4 columns are the ones we’re going to be calculating. I broke the ratings formula into two pieces: odds and rating. The DCI formula cites
(1/((10^((OPPONENT RATING-OLD RATING)/400)+1))
as being the odds for someone of winning a particular match. Your formula for odds should look like:
=1/((10^((O2-N2)/400)+1))
This makes the new rating formula much easier. It will now look like:
=O2+(H2*(IF(M2=”win”, 1, 0)-P2))
Now all that is left is the gamer and opponent ratings. Your formula should be:
=IF(I2 =0, 1600, VLOOKUP(B2,A:Q, 17, FALSE))
And for opponent use this formula:
=IF(L2=0, 1600, VLOOKUP(D2,A:Q, 17, FALSE))
Now that you have columns M, N, O and P filled in the first row, just highlight all four of them and drag them down until the last row. Save this file and go back into MS Access. Go to File -> Get External Data -> Link Tables. Find the spreadsheet you just saved in the pop-up (you may need to change the file type in the bottom drop-down to include Excel files). Click through the wizard hitting next. Make sure that the “First Row Contains Column Headings” box is checked off and name the table rating. You now have access to the file we just created, but as a table in your DB.
We need to create 1 more query to get the most recent rating for each person. Create a new query and choose the rating table you just linked. Choose Gamer, new_rating (you can rename it to just rating if you want to), and match_ID. On the bottom half of the screen, uncheck the box for match_ID where it says show. Input the below formula in the criteria of match_id:
(select max(r2.match_id) from rating r2 where rating.player_id=rating.player_id and rating.match_id=rating.match_id)
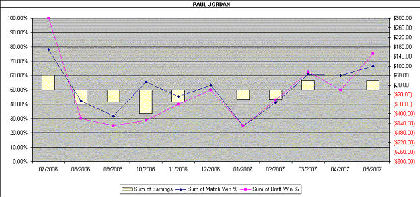
Be sure to save your query. Believe it or not, that’s it. There are literally countless other things that you could do with the information. I have a number of queries and pivot tables that show trends, how people do against specific people or with other gamers on their team, etc. You can even set up charts such as this:
It takes a while to get used to, but after doing it a little it is pretty easy to run updates. Be sure to refresh your data in Excel whenever you add information to the DB.
I’m sure there are a number of metrics I haven’t thought that could be cool. Please feel free to share these in the forums. I’d also be happy to help folks trying to set up their own DB. I hope this has been helpful for people out there. It is a lot of set up work, and a decent amount of maintenance — especially tracking down results — but it has added a lot of fun to our draft group, I’m sure it could to yours.
PJ
